Difference between revisions of "Global warming/hockey stick"
Jump to navigation
Jump to search
(Created page with "thumb|one version of the hockey stick, from the IPCC 3rd Assessment Report in 2001 ==About== The "hockey stick" is a well-known shape often ...") |
(2 more images) |
||
| (2 intermediate revisions by the same user not shown) | |||
| Line 1: | Line 1: | ||
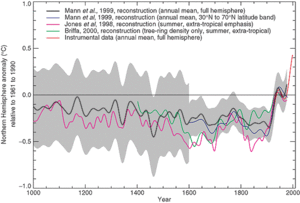
[[File:IPCC 3AR 2001 Fig2-21.gif|thumb|one version of the hockey stick, from the IPCC 3rd Assessment Report in 2001]] | [[File:IPCC 3AR 2001 Fig2-21.gif|thumb|one version of the hockey stick, from the IPCC 3rd Assessment Report in 2001]] | ||
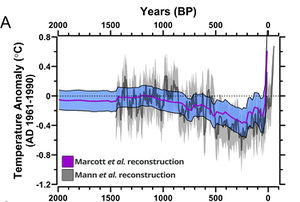
| + | [[File:Marcott-A-1000.jpg|thumb|a 2013 version of the hockey stick, with data going back further]] | ||
| + | [[File:Capitalist Climate by oxpeaceart updated by Fairfax Climate Watch.png|thumb|another 2013 version, this time showing CO<sub>2</sub> levels going back ~420ky]] | ||
==About== | ==About== | ||
The "hockey stick" is a well-known shape often found in charts showing global temperatures, where the time-span shown is at least a century or two and ends in the present. | The "hockey stick" is a well-known shape often found in charts showing global temperatures, where the time-span shown is at least a century or two and ends in the present. | ||
| Line 7: | Line 9: | ||
===Reference=== | ===Reference=== | ||
* {{wikipedia|Hockey stick controversy}} | * {{wikipedia|Hockey stick controversy}} | ||
| + | ==More Images== | ||
| + | <gallery> | ||
| + | File:2000yearsCO2large.png | global temperatures and atmospheric CO<sub>2</sub> for the past 2000 years | ||
| + | File:2008-12-20 fig1b.gif |Annual-mean global-mean anomalies, 1880-2007 | ||
| + | </gallery> | ||
Latest revision as of 17:17, 4 November 2013
About
The "hockey stick" is a well-known shape often found in charts showing global temperatures, where the time-span shown is at least a century or two and ends in the present.
Pages
- /deception: global warming skeptics often claim that the hockey stick is a deception of some sort and does not represent a real phenomenon


