Divorce/data
< Divorce
Jump to navigation
Jump to search
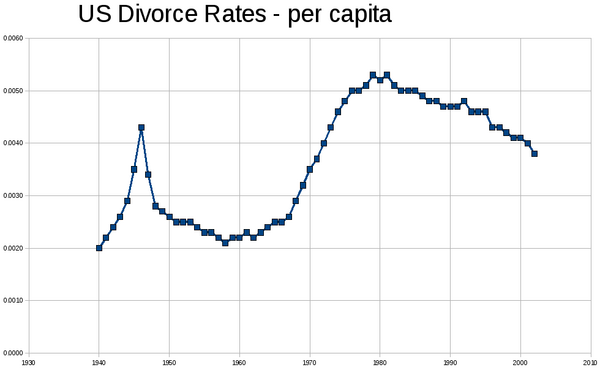
US Per capita divorce rates
These data are also available as an editable spreadsheet
| Year | # per capita | Sources |
|---|---|---|
| 1940 | .0020 | 3 |
| 1941 | .0022 | 3 |
| 1942 | .0024 | 3 |
| 1943 | .0026 | 3 |
| 1944 | .0029 | 3 |
| 1945 | .0035 | 3 |
| 1946 | .0043 | 3 |
| 1947 | .0034 | 3 |
| 1948 | .0028 | 3 |
| 1949 | .0027 | 3 |
| 1950 | .0026 | 2,3 |
| 1951 | .0025 | 3 |
| 1952 | .0025 | 3 |
| 1953 | .0025 | 3 |
| 1954 | .0024 | 3 |
| 1955 | .0023 | 2,3 |
| 1956 | .0023 | 3 |
| 1957 | .0022 | 2,3 |
| 1958 | .0021 | 3 |
| 1959 | .0022 | 3 |
| 1960 | .0022 | 2,3 |
| 1961 | .0023 | 3 |
| 1962 | .0022 | 3 |
| 1963 | .0023 | 3 |
| 1964 | .0024 | 3 |
| 1965 | .0025 | 2,3 |
| 1966 | .0025 | 3 |
| 1967 | .0026 | 3 |
| 1968 | .0029 | 3 |
| 1969 | .0032 | 3 |
| 1970 | .0035 | 2,3 |
| 1971 | .0037 | 2,3 |
| 1972 | .0040 | 2,3 |
| 1973 | .0043 | 2,3 |
| 1974 | .0046 | 2,3 |
| 1975 | .0048 | 2,3 |
| 1976 | .0050 | 2,3 |
| 1977 | .0050 | 2,3 |
| 1978 | .0051 | 2,3 |
| 1979 | .0053 | 2,3 |
| 1980 | .0052 | 2,3 |
| 1981 | .0053 | 2,3 |
| 1982 | .0051 | 2,3 |
| 1983 | .0050 | 2,3 |
| 1984 | .0050 | 2,3 |
| 1985 | .0050 | 2,3 |
| 1986 | .0049 | 2,3 |
| 1987 | .0048 | 2,3 |
| 1988 | .0048 | 2,3 |
| 1989 | .0047 | 2,3 |
| 1990 | .0047 | 2,3 |
| 1991 | .0047 | 1,2 |
| 1992 | .0048 | 1,2 |
| 1993 | .0046 | 1,2 |
| 1994 | .0046 | 1,2 |
| 1995 | .0046, |
1,2 |
| 19961 | .0043 | 1,2 |
| 1997 | .0043 | 1,2 |
| 1998 | .0042 | 1,2 |
| 1999 | .0041 | 1,2 |
| 2000 | .0041, .0042 | 1,2 |
| 2001 | .0040 | 1,2 |
| 2002 | .0038 | 1 |
Sources
- 1. Americans for Divorce Reform: Divorce Rates - Divorce Statistics Collection
- 2. 2003 Statistical Abstract of the U.S. Section 2 (US Census Bureau), Table 83 (page 4) -- but numbers were copied from here and need to be checked for accuracy; inclined to distrust this source's figure for 1995
- 3. 1995-03-22 Monthly Vital Statistics Report, Vol. 43, #9 (Centers for Disease Control), Table 1 (page 9)
Notes
1. Originally said "1995", but this must be a typo
