Search results
Jump to navigation
Jump to search
Page title matches
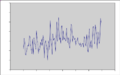
File:2014-07-11 climate data comparison.svg ...ld data (blue) has connecting lines, so it is easier to see behind the new data (pink)(492 × 308 (39 KB)) - 17:14, 12 July 2014
File:2014-07-11 climate data comparison.ods ...s.nasa.gov/gistemp/graphs_v3/Fig.D.txt here], as suggested by [[2012/07/30/Data Tampering At USHCN/GISS]](55 KB) - 17:20, 12 July 2014

Page text matches
File:2014-07-11 climate data comparison.svg ...ld data (blue) has connecting lines, so it is easier to see behind the new data (pink)(492 × 308 (39 KB)) - 17:14, 12 July 2014File:2014-07-11 climate data comparison.ods ...s.nasa.gov/gistemp/graphs_v3/Fig.D.txt here], as suggested by [[2012/07/30/Data Tampering At USHCN/GISS]](55 KB) - 17:20, 12 July 2014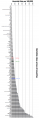
File:CPRC-homicide-rates-more-legible.png ** Most data is from 2008 UNODC homicide statistics ** Cape Verde, Mozambique, and Saudi Arabia are from 2007 data(1,869 × 5,661 (1.05 MB)) - 13:54, 11 September 2015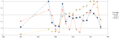
File:2009-01-26 abortion clinic selected stats normalized.png Where ''gd'' is the data as graphed and ''sd'' is the source data: ...average for the years 1977-1992, which are added together in the original data; gd = sd/16(1,103 × 346 (15 KB)) - 20:11, 26 January 2009File:US public debt by party.ods [[category:data]] ...y controlling Congress and (b) changes to the [[US national debt]]. Better data is needed. Normalization by showing debt as a percentage of the GNP (probab(33 KB) - 17:37, 10 February 2012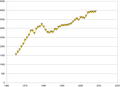
File:Global oil production.png .../statistical_review_of_world_energy_full_report_2009.xls BP Oil historical data] -- 5th tab, "Total World" row(609 × 440 (8 KB)) - 17:03, 27 December 2009
File:Wolfram Alpha - US marginal tax rates - 2000 - numbers.gif [[category:data]](311 × 217 (6 KB)) - 22:02, 7 November 2011
File:Wolfram Alpha - US marginal tax rates - 2000 - chart.gif [[category:data]](496 × 148 (5 KB)) - 22:02, 7 November 2011
File:Wolfram Alpha - US marginal tax rates - 2008 - numbers.gif [[category:data]](303 × 249 (6 KB)) - 22:04, 7 November 2011
File:Wolfram Alpha - US marginal tax rates - 2008 - chart.gif [[category:data]](496 × 170 (5 KB)) - 22:22, 7 November 2011
File:Wolfram Alpha - US marginal tax rates - 1980 - chart.gif [[category:data]](496 × 335 (9 KB)) - 21:54, 7 November 2011
File:Wolfram Alpha - US marginal tax rates - 1992 - numbers.gif [[category:data]](279 × 153 (4 KB)) - 21:56, 7 November 2011
File:Wolfram Alpha - US marginal tax rates - 1992 - chart.gif [[category:data]](496 × 115 (3 KB)) - 21:57, 7 November 2011File:US Divorce Rates.ods Spreadsheet and graph generated from [[Divorce/data]](22 KB) - 14:09, 31 May 2009
File:Wolfram Alpha - US marginal tax rates - 1980 - numbers.gif [[category:data]](295 × 565 (12 KB)) - 21:53, 7 November 2011File:2010-05-24 teen pregnancy vs sex ed stats.ods [[category:data]] * '''Sources''': [http://www.thenationalcampaign.org/state-data/state-comparisions.asp?id=3&sID=18#source teen pregnancy rates] [http://www(20 KB) - 19:36, 24 May 2010
File:2011-08-19 1034 Gplus suspension.png ...tps://plus.google.com/u/0/settings/exportdata make a copy] of your Google+ data first. Then, click [https://plus.google.com/u/0/downgrade/ here] to leave G(1,280 × 1,024 (239 KB)) - 14:51, 19 August 2011


