US/gov/spending/by president
< US | gov | spending(Redirected from US Presidential Administration Budgets)
Jump to navigation
Jump to search
About
This article relates to comparisons of budgetary spending and policy across the different United States Presidential administrations.
Numbers
| Deficit | Debt | ||||
|---|---|---|---|---|---|
| Date | $ | %GDP | $ | %GDP | president |
| 1992-09-30 | 4,064,620,655,521.66 | Bush I leaving, Clinton incoming | |||
| 2000-09-30 | 5,674,178,209,886.86 | Clinton leaving, Bush II incoming | |||
| 2007-09-30 | 9,007,653,372,262.48 | Bush II leaving, Obama incoming | |||
Links
Reference
- Historical Debt Outstanding – Annual: year-by-year listings of the US public debt, going back to 1791
- earlier incarnation of that information
To Be Filed
- 2013-10-20 Celebrated chef Tom Colicchio tweets that relatively little debt accumulated under Barack Obama: FALSE
- 2013-07-24 Obama says deficit is falling at the fastest rate in 60 years: TRUE
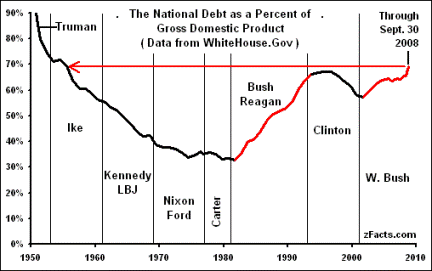
- 2008-07-20 The United States Has Not Had A Balanced Budget Since 1957! (archived) explains how the claims of a surplus for Clinton are actually derived by leaving out part of the debt.
- Just For the Record by Dwight Meredith: multiple comparisons across Kennedy/Johnson, Nixon/Ford, Carter, Reagan, Bush I, and Clinton administrations. Summary (all figures are in 1996 dollars):
- Republican presidents increased the national debt by $3.8 trillion, with an average annual deficit of $190 billion.
- Democratic presidents increased the national debt by $719.5 billion, with an average annual deficit of $36 billion.
- The Latest Data on Bush's Spendthrift Ways: Percentage Changes in Real Discretionary Spending for LBJ, Nixon, Reagan, Clinton, and Bush
- How to Withstand the Coming Bush Economic Crisis: analysis of expected effects on the economy, written for portfolio investors
- President Reagan, Champion Budget-Cutter by Veronique de Rugy of the American Enterprise Institute
